Tuesday, September 29, 2009

Glantz @ Chartz: $WTIC/$USD


Oil has broken lower and with the US Dollar finding support at 76 we could see further downside.
*click on chart to expand image

Monday, September 28, 2009

Itz Pix Recap


Stocks rallied on the open and put in a nice day, BUT...you knew I would have something to say... it was on light holiday volume (Yom Kippur)and in some extent end of quarter window dressing. Nice breakout on Abbott Labs (ABT) this stock even after its recent acquisition of Solvay Pharma.
I originally suggested Abbott back on August 2nd see postlink


Sunday, September 27, 2009

Weekend Review


Over the past week, I alerted readers that the equity market looked primed for a pullback, I know how many times have you heard that recently? The bottom line is one should protect recent market gains and in this case, the Itz Pix portfolio. I suggested using covered calls or a put strategy for those more seasoned traders, but for basic and ease of discussion, I'll focus on the ProShares leveraged ETF's SDS & QID. (see charts below)

The week ahead presents several key economic reports, the GDP,ISM Reports, Challenger Employment & the big one...the Jobs Report on Friday!

I continue to focus on the US Dollar, it seems to be dictating the moves in equities as well as commodities. That pesky 76 level has been strong support near term and a technical bounce to the 78 upper-end of the down trending channel a possibility. This is what I see bringing on the pullback, which will be the "pause that refreshes" as we approach earnings season and a year end rally.
The suggested hedges using the Proshares SDS & QID are short term hedges with tight stops.

*click on chart to expand image


Friday, September 25, 2009

ALERT: HEDGE GAINS


**ALERT** Sept.25 3:02PM

HEDGING ITZ PIX Portfolio! Suggest entering ProShares Ultra Short S&P 500 (SDS) @ $41.15 & Ultra Short QQQQ (QID) @ $23.50.

Charts indicate a sizable decline near term... more later

Thursday, September 24, 2009

The New Dollar Carry Trade


*click on chart to expand image

Dollar Up, Oil, Gold, Silver Down


Oil prices continue to decline for a second straight day as growing supplies of crude, gasoline and heating oil exposed how badly the U.S. recession has cut into energy demand.Oil demand fell by 3 percent, the government reported, and gasoline supplies surged by more than 5 million barrels even though refineries took in 316,000fewer barrels of crude each day. Still, the U.S currency continues to influence prices because a weak dollar effectively makes dollar-based crude cheaper.
News from the G-20 meeting could sway the value of the dollar and oil...as I type the $USD is @ 76.867, well off the lows of yesterday afternoon, just 24 hours ago.

Crude oil ($WTIC) has broken out of its ascending triangle formation and appears to want to test July lows. Transocean (RIG) which broke out of the same triangle formation looks like it will gravitate to the $80 level.

Yesterday, I suggested those in the Itz Pix Portfolio, to hedge positions with covered calls or a put strategy. This maybe the start of the overly late correction. *click on chart to expand image

Wednesday, September 23, 2009

UPDATE: NATGAS 4 Weeks Later


Just about 4 weeks ago, I posted (~link to post~) that Natural Gas stocks looked attractive and relative to crude oil stocks...very cheap. Matter of fact the Crude OIl to Natgas ratio was at an extreme reading of 22:1 and has in just 4 weeks pulled in to the 15 level. With winter approaching the build in natgas should work off if we see a colder than normal season. EIA report link

Although I didn't place the NatGas stocks into the Itz Pix Portfolio, they are nicely from my suggestion on August 28th!
*click on charts to expand image


OK You Can Exhale Now.... FOMC Statement


The Federal Reserve released its statement (~link~) on their September meeting and it basically sent the dollar lower. They didn't take away the punch bowl! The Fed also said it would extend its $1.25 trillion of mortgage-backed securities purchases from Fannie Mae and Freddie Mac into the first quarter of 2010. It previously was scheduled to end those purchases at the end of this year.

The dollar immediately dropped on the press release from 76.2 to 75.88 ~link~

Dollar continues it's decline, thus equities are up, commodities (metals) up although oil is down after the EIA weekly report showing an increase in supply. In the Itz Pix Portfolio Apple (AAPL) continues to be the hot stock this week...$200 looks likely soon! Google (GOOG) following right behind. Alcoa & Hecla Mining strong too...

The charge here in equities is also a chase to the end of quarter performance by money managers, look at hedging positions by selling some out of the money calls on the big gainers and buying some put options.

Tuesday, September 22, 2009

*NEWS ALERT!* Is The Fed About To Announce An Early Exit Plan?


Are Central Bank officials discussing plans to use so- called reverse repurchase agreements to drain some of the $1 trillion they pumped into the economy?

The staff presented an update on the continuing development of several tools that could help support a smooth withdrawal of policy accommodation at the appropriate time. These measures include executing reverse repurchase agreements on a large scale, potentially with counterparties other than the primary dealers; implementing a term deposit facility that would be available to depository institutions in order to reduce the supply of excess reserves; and taking steps to tighten the link between the interest rate paid on reserve balances held at the Federal Reserve Banks and the federal funds rate. -- Minutes of the Federal Open Market Committee August 11-12, 2009 ~link~


"Fed Said to Start Talks With Dealers on Using Reverse Repos" Bloomberg Report Link

With the reverse repos -- short for reverse repurchase transactions -- the Fed would sell securities to its 18 primary dealers for a specific period, which would decrease the amount of money available in the banking system. If it issues $1 trillion worth of reverse repos, the Fed would be able to use the cash to restore its balance sheet part of the way back to its pre-August 2007 condition.

Those that follow my blog & Itz Pix has played the weaker dollar and rising commodity prices -- gold, silver, copper, & oil. That's because one of the surest bets in the last few years has been that rising U.S. debt would weaken the dollar -- particularly when borrowers were using their money to short the dollar and go long on commodities futures.

This may or may not be mentioned in tomorrow's meeting by the Fed. BUT, this is an important news release from Bloomberg and as I type being discussed on several cable news programs. Stay alerted...more on this tomorrow....

Dollar Back At The 76 Level....


"Buy Stocks Because U.S. Dollars Will Be Worthless," according to Marc Faber, editor of The Gloom, Boom & Doom Report. However, in the near term, Faber sees plenty of money-making opportunities in certain equities. Sure, prices aren't as cheap as they were in March, yet he's confident, "in this environment cash will become worthless." As a result, he says investors are, "better off being in equities," for the next two to three years. Faber is most bullish on mining and energy companies, such as Newmont Mining (NEM) and FreeportMcMoran (FCX); again inline with my ITZ PIX portfolio theme!

Fed Chairman Bernanke has said that the recession is "very likely over," but the Fed isn't acting like we're in a recovery. Economists widely believe the central bank will keep interest rates between 0% and 0.25% at the conclusion of its two-day meeting this Wednesday. One would expect the Fed to raise interest rates once a recovery started, but it hasn't in part because this recovery is weak and tepid, we could see a jobless recovery. Which would mean that consumer spending will be as weak. Unemployment is still rising, retail sales are far from robust, manufacturers' capacity utilization remains at ultra-low levels and wages are still depressed. Home sales and new home construction are making a comeback, but they're coming off of historic lows.

As for the US Dollar, that bounce yesterday didn't last very long did it? Back down to that all important support level of 76. A sustainable break below could the final boost for gold to trade above the $1033 resistance level and for the DJIA to break over 10,000. But then what? Most traders can live with a steady decline in the dollar, but a rapid plunge near term could scare off equity investors and spike gold to extreme levels. Marc Faber's commentary is on a long term view of the dollar, many scoff at his views, but even so, just look back to this March and how close (even according to the President, Fed Chairman & Treasury Secretary) we came to falling into an financial abyss?

The dollar is now so weak that it has become the currency of choice for the new “carry trade” – where investors borrow currencies at low rates and invest in another currency at higher rates. Simon Derrick at The Bank of New York even said that “The dollar is the new yen.”

Another shocking fact about America’s waning world influence comes from the Boston Consulting Group (BCG) ~read story~, which issued a report that showed how Europe has surpassed North America as the richest region in the world. The BCG report said global wealth fell 11.7% to $92.4 trillion in 2008, the first decline since 2001. North America saw the biggest decline in wealth, falling 21.8% in 2008. The total wealth in Europe fell by only 5.8%, while Latin America was the only region where wealth grew, by 3% in 2008.

One other interesting comment last week came from former Fed Chairman Alan Greenspan, who said that he is worried that Congress will hamper the Fed’s efforts to rein in its monetary stimulus, and that inflation might “swamp” the bond market. Specifically, Greenspan said in a broadcast to Tokyo clients of Deutsche Bank Securities on Wednesday that “it’s the politics in the United States that worries me.” Mr. Greenspan also warned that the U.S. must rein in its “very dangerous” level of debt.”


Monday, September 21, 2009

Dollar Bounces Off Of 76 Level


The US Dollar advanced on Monday, up for a third day versus the euro and a basket of currencies, as investors shied away from risk-oriented trades ahead of this week's meeting of U.S. Federal Reserve policy makers.As I noted recently that the 76 level would most likely present a technical bounce. The trend is still downward in my view, trading within a descending channel since June.

The Fed's rate-setting Open Market Committee could opt this Wednesday a signal it's ready to begin outlining an exit strategy from its massive monetary-stimulus efforts helped pressure equity markets, spurring support for the dollar. Also this week is a summit of the leaders of the Group of 20 global economic powers, which gets under way Thursday in Pittsburgh.

Still, dollar weakness has been exacerbated in recent weeks amid signs the greenback is taking on a role as a funding currency for carry trades, in which investors sell a low-yielding currency and purchase higher-yielding currencies.
Use any bounce here in the Dollar to buy on dips in equities.

Interesting view from veteran trader Art Cashin (CNBC)
*click on chart to expand image


Sunday, September 20, 2009

S&P 500 Most Overbought Since 1983...BUT...


The S&P 500 ($SPX) as of 9/18/09 is trading 20.13% above its 200-day moving average. An extreme overbought reading, and its also the highest reading in this indicator since May 6, 1983.
A notable statistic, and one that supports the notion that the market has run too far to make new buys at these levels. On the nearterm, taking some money off the table is warranted and the theme of BUYING the DIPS remains.

What I find of interest about this statistic is that while 1983 was the first year of the big market liftoff that started in 1982, it was still the beginning of a multi-year bull market. Definitely NOT a good long-term sell signal.

Regardless of trying to nail the next short-term moves in the market, I think the market will continue to work its way higher into year-end and next year. I think it is likely that at some point we will reach those pre-Lehman levels of 1200 on the S&P 500.
*click on charts to expand images


Wednesday, September 16, 2009

Utility Index Ready To Rally


The Utility sector ($UTIL) is a laggard to the major indexes. With the $SPX hitting 1060 today, it has given a bullish signal. Watch the $UTIL break over the 380/390 level and make a run. I'm suggesting the ProShares Ultra Utilities (UPW) around $36 level, currently $35.80

*click on chart to expand

Tuesday, September 15, 2009

Update on Silver Wheaton (SLW)


Silver Wheaton (SLW) is up against some resistance and should consolidate here.

*click charts to expand image


ITZ PIX Update: Dollar Continues Decline


Bernanke says recession 'very likely over,' but unemployment pain will linger, dollar plunged as investors exited it as a safe haven. The US Dollar ($USD) may find some support at the 76 level nearterm, I see it putting in a technical bounce there. But this rally in stocks & commodities is being driven mainly by 2 things- lower dollar & those chasing the rally. Buy the dips still holds. The Itz Pix portfolio has been reflecting the lower dollar & higher commodities move.

*click on chart to expand image


Need to learn how to trade to stay ahead? For your best chances, click here

Sunday, September 13, 2009

BREAKOUT!


Several index charts have broken out or are close to breaking out. September as well as October have historically seen markets correct, however the resilience of this market has been remarkable. The trend is up and the dips should be bought. My favorite sector currently is silver & the drillers, specifically Transocean (RIG) & Silver Wheaton (SLW).


Thursday, September 10, 2009

ITZ PIX Portfolio Update


Itz Pix Stock Portfolio is on fire as my gold & commodity suggested buys are up HUGE in just 8 weeks. Today the ProShares Ultra Short S&P 500 ETF (SDS) exited as it hit it's $42 STOP. On the upside my report on Silver Wheaton (SLW) took off today, I have it on my radar and will NOT chase this stock. I would really love to buy it on a pullback. The major market continues to climb, in part to a lower US Dollar, now here I see at least a technical bounce. Another concern is the low Volatility Index ($VIX) hitting an intraday low of 22.82 today.On the last chart, I played with the $VIX & $SPX, and asked...what if? Basically eliminating the huge historic parabolic surge in the $VIX. Hmmm?? Need to learn how to trade to stay ahead? For your best chances, click here


*click on charts to expand images


ITZ PIX: Portfolio Update (SDS)


Itz Pix suggested hedge ProShares Ultra S&P500 (SDS) is trading around the STOP of $42. Entry level was $44.62, keep an eye on this, if it continues to trade at this level prior to the close, SELL. We can re-enter this trade again. Remember this ETF trades at a 2:1 leverage to the inverse of the underlying index. Link to chart

Yamana & Silver Wheaton Updates


Recapping the Yamana Gold (AUY) Itz Pix trade & Silver Wheaton (SLW) that's on the Itz Pix radar watchlist:
As I type the US Dollar ($USD) is trading around the 77 level and commodities are up, Yamana Gold is trading at $10.54 +3.85% intraday, & Silver Wheaton (SLW) $12.10 +3.59% intraday. Below are some interesting charts a look at SLW channels and the other of Yamana (AUY) against a Gold:US Dollar as well as a Silver:US Dollar chart. the silver one is interesting. After all AUY is also into mining silver as well as copper & of course gold. It's been lagging the last few weeks, need to watch this. More later....
*click on chart to expand images


Wednesday, September 9, 2009

The Silver Lining: Silver Wheaton (SLW)


The Gold to Silver ratio represents the price of silver ($SILVER) relative to the price of gold ($GOLD); simply the price of gold divided by the price of silver represented in the form of a ratio. If the price of gold is $1,000/oz. and the price of silver is $20/oz. then the gold to silver ratio would be 50:1, or simply "50" (1,000 divided by 20 is 50).Need to learn how to trade to stay ahead? For your best chances, click here


Natural Supply
One factor determining the gold to silver ratio is the physical ratio of these naturally occurring elements in the earth's crust. According to the U.S. Geological Survey, on average silver occurs at 0.07 parts per million, and gold at 0.004 parts per million in the Earth's crust. Thus, the naturally occurring gold to silver ratio is 17.5:1.
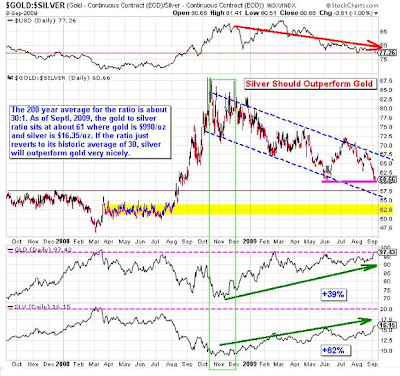
Historical Ratio
Historically, the price of silver drops faster than gold in a precious metals bear market and rises faster than gold in a precious metals bull market. The ratio is therefore applicable in determining market direction. Just look at the recent rise in gold & silver prices in the annotated chart below.

In the last great precious metals bull market, 1960 - 1980, silver outperformed gold about 2.3 times (230%). Gold rose from $35 to $850 or a gain of 2,429%. Silver rose from 90 cents to $50, or a gain of 5,555%, and 229% better than gold.

Current Ratio
The 200 year average for the ratio is about 30:1. As of September, 2009, the gold to silver ratio sits at about 61 where gold is $950/oz and silver is $16.35/oz. If the ratio just reverts to its historic average of 30, silver will outperform gold very nicely.

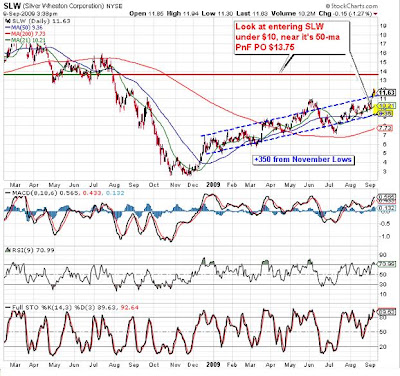
One can trade using the Silver ETF (SLV) or trade an individual stock, my pick is Silver Wheaton ticker symbol (SLW). Silver Wheaton Corp. operates as a silver streaming company. The company purchases silver form Luismin, Peñasquito, Campo Morado, and La Negra mines in Mexico; Zinkgruvan mine in Sweden; Yauliyacu mine in Peru; Stratoni mine in Greece; Mineral Park mine in Arizona; and Keno Hill property in Canada. The company was incorporated in 1994 and is headquartered in Vancouver, Canada. homepage

What makes SLW attractive is the recent Barrick Gold deal (link to story)

TRANSACTION HIGHLIGHTS

Provides immediate cash flow.
Silver Wheaton will receive 100% of the silver production from three of Barrick's currently producing mines, effective September 1, 2009, until the end of 2013.
This immediately enhances Silver Wheaton's production and cash flow profile, by adding average annualized silver production of approximately 2.4 million ounces until Pascua-Lama commences production.
Significantly increases Long Term Growth Profile.
Silver Wheaton will receive 25% of the life of mine silver production from Barrick's Pascua-Lama project, expected to be one of the largest and lowest cost gold mines in the world.
Pascua-Lama is a key Barrick growth asset and is the third largest silver deposit in the world, with an estimated mine life of over 25 years.
Silver Wheaton's 25% share of the estimated average annual silver production for the first five years (2013 to 2017) is 9 million ounces, boosting overall silver sales by 30%.
Barrick has provided a completion guarantee, requiring them to complete Pascua-Lama to at least 75% of design capacity by December 31, 2015. If Barrick does not meet completion by December 31, 2013, Silver Wheaton will continue to receive silver production in 2014 and 2015 from the currently producing mines, until Barrick satisfies the requirements of the completion guarantee.

I'm looking for SLW to pullback nearterm to the $10 level, it is currently trading at the upper end of it's ascending channel. As it pulls back one could lower their cost basis by selling an October put option, the $11 put (SLWVR) could bring in $0.65 as the stock trades at $11.66 or start accumalating the stock here, the option expire in 5 weeks a 52% yield. This bears watching as is an alternative trade option.

*click on chart to expand image


APPLE & the SPY


Steve Jobs, CEO of Apple Inc. appeared on stage at a media event in San Francisco Wednesday in his first public appearance since returning to the company from a medical leave earlier this year. Jobs underwent a liver transplant and was away from the company for the first six months of the year. He returned to active duty at the end of June. His appearance was part of a company-sponsored media event to update its line of iPods and other music offerings. First of all, investing aside, I'm very happy to see Mr. Jobs is back and wish him good health and happiness. He is an inspiration to young entrepreneurs in America and his genius has created what I consider the leading innovative technology company in the world.

This market has been driven by technology and could today with his appearance mark a nearterm top? The stock hit a 52-week high of $174.47 when he took stage...but we need to see what new products Apple bring in the coming weeks. Rumor has been on the "Beatle's" deal will or will it happen? I don't see it because they don't want to step on the sales of the remasterd CD's. If a deal is made...Apple will skyrocket! The suspense builds. AAPL stock is part of the Itz Pix Portfolio recommended @ $141 up now +23.5%.

*click on chart to expand image


Dollar Update


As a follow up to yesterday's US Dollar blogpost. The US Dollar as I type is trading around 76, gold is flat hovering that psychological $1,000 level. The $:YEN is at 91.73 lowest level since February, then again all currencies are down across the board. The weak dollar and strong Chinese oil demand is propping oil prices, OPEC minister said this morning that they are "happy" with oil at $70 per barrel. I have been repeatedly calling that the charts indicate oil breaking over $75 resistance and running up to $90. Oil lags golds moves and gold is breaking out, expect crude oil to follow!

I'm suggesting the offshore drillers the $OIH, or specifically Transocean ($RIG) which is in my Itz Pix suggested stocks list. By the way the leaders in my stock picks since July '09 are Hecla Gold ($HL) is a whopping +55% in 2 months, copper mining stock Freeport McMoran ($FCX) +51% & Alco ($AA) +40%...oil stocks include Transocean ($RIG) +19.63% & Valero ($VLO) +16.5% which I see energy following gold & these 2 stocks ready to really climb!

Some interesting articles on oil... The Global Economic Crisis: Strategic Implications for Turkey, Europe and the United States ... Spinning for Russia

*click on chart to expand image


Tuesday, September 8, 2009

Gold Breaks Higher, US Dollar Breaks Lower


Gold rose to the highest price since March 2008, topping $1,000 an ounce, while silver climbed to a 13-month high as a weaker dollar and concern that inflation may accelerate boosted the appeal of precious metals. President Barack Obama has increased the nation’s marketable debt to an unprecedented $6.78 trillion as he borrows to spur the world’s largest economy. Goldman Sachs Group Inc. predicts that the U.S. will sell about $2.9 trillion of debt in the two years ending September 2010. The SPDR Gold Trust(GLD), the biggest ETF backed by the metal, reached an all-time high of 1,134.03 metric tons on June 1. The fund, which held 1,077.63 tons as of Sept. 4, has overtaken Switzerland as the world’s sixth-largest gold holding. Bullion held in ETF Securities Ltd.’s exchange-traded products gained 6,640 ounces to a record 8 million ounces (248.8 tons) yesterday, its Web site showed.Gold is rising fastest in dollar terms – since the dollar is falling relative to most other currencies. The dollar index is down almost 15% since last March as investors around the world continue to shun the U.S. dollar. I expect that President Obama will ask Americans to “save” more, on Wednesday night in his joint session before Congress. If the U.S. savings rate does not increase, the federal government’s massive budget deficit may not be able to be financed from foreign investors, especially BRIC (Brazil, Russia, India and China) countries and many Middle Eastern countries that are now shunning the U.S. dollar. As a result of those governments fleeing the dollar, this is the first year the U.S. has ever lost foreign capital.

Barrick Gold Corp., the world's biggest gold producer, said Tuesday it plans to eliminate all of its gold hedges and raise $3 billion in a share offering to help pay for the move. This could be seen as both bullish and bearish for gold...depending in what camp your in? ~link to story~
Below is a chart I posted back on 8/27 & today's break lower on the dollar signals that gold may go higher.

*click on chartz to expand image


Thursday, September 3, 2009

Will Crude Oil Follow Gold Higher?


Gold continues to rally with an intraday high today of $999.50. Gold mining stocks have been outperforming the metal itself, most believe that miners are not as hedged now. I've mentioned previously on this blog, that $GOLD has traded ahead of crude oil $WTIC by 4 -6 months. Looking at the annotated chart I've posted tonight, you can see that the same breakout formation is developing in crude oil. That $75 price has been resistance. Now the run up to $140+ was speculative driven. BUT...with gold breaking out this week...does this possibly suggest crude oil ($WTIC) breaking out over $75 by January 2010??? Indeed, something that needs to be monitored. If so and gold meanwhile continues to climb, on momentum I may add, then now maybe the time to begin accumulating energy stocks? One reason I suggested RIG (or the OIH), back in early July for the Itz Pix portfolio.

*click on chart to expand

Wednesday, September 2, 2009

Itz Pix: Portfolio Update


It looks as if the correction has begun, with the a positive ISM # not helping along with the ADP report, Friday should be extremely pivotal. That's when the August Jobs Report comes out. My view is that the jobs number will disappoint and the selling continues, especially as we enter a 3-day weekend. Gold had a technical breakout, as I have been calling for. Starting to look as if $1000 will be tested, maybe a new high set. However, I think that it may peak there, inflation still has not raised its ugly head. As I posted earlier today, September has normally been a bullish month for gold as too a bearish month for equities. I would say one should buy protective puts on any gold positions. Yamana Gold (AUY) was up 12.85% & Hecla Mining (HL) +8.3%. My downside target on the S&P 500 ($SPX) continues to be 950. Stay hedged using the ProShares ETF SDS, maintain a stop at $42.
*portfolio began on July '09

GOLD BREAKING OUT?


Is gold breaking out or is this a technical move? September has historically has been a bullish month for gold, over the last 20 years, it has risen on average 3.4% in 16 of those years. ~see story~

I suggested to my blog readers that gold was a buy last week see post

Gold's move today has been on no move in the US Dollar, I've been expecting a drop below the $78 support level. (see chart in past post). However...today's move could be seen in part as both a technical & a safety move as money is allocated into the commodity against further declines in the equity markets.

*click on chart to expand image

Tuesday, September 1, 2009

Volatility spikes ($VIX)


I pointed out the tight Bollinger Bands about a week ago, noting that they signaled a breakout shortly. The market is selling on really good news from the ISM report, with the Jobs report out Friday, I wonder if this is a buy the dip opportunity? OR will this be the start of the long awaited correction. Its not the news, but the perception of the news...

*click on chart to expand image

Is China's market leading us into a bear market?


Has the Shanghai Index ($SSEC) been leading the US stock market? From 2002 - 2007 there was a 40% correlation, from 2008 to present its been 80%.

*click on chart to expand image